Mapping and aerial surveying is a new venture I’m actively developing. At this stage, I offer these services at no additional cost, as I welcome opportunities to build experience and refine my workflow in real-world applications.
I am largely self-taught in drone-based mapping and survey techniques, and my academic background at Western Sydney University has further supported this with foundational knowledge in geospatial analysis, including the use of ArcGIS and interpretation of satellite imagery (e.g., spectral band analysis). Notably, I dedicated an entire university module to exploring Remote Sensing and GIS applications in complex scientific case studies.
For aerial surveying, I use a combination of Pix4D Enterprise and ArcGIS to produce:
- 3D models - Orthomosaics - Digital Surface Models (DSMs)
Compared to traditional satellite imagery platforms such as Landsat, which offer resolutions of around 30–60 m/pixel and even higher-resolution urban satellites offering approximately 30 centimetres per pixel, UAV-based mapping can achieve Ground Sampling Distances (GSD) of less than 12 cm/pixel, depending on conditions. This allows for the creation of high-accuracy, real-time datasets suitable for construction planning, environmental monitoring, infrastructure design, and more.
⚠️ Note: Due to current computer hardware limitations, I can only offer full data processing for small-scale projects. For larger-scale operations, I am able to supply raw drone imagery, which can then be processed externally by a specialist or in-house GIS team. ⚠️⚠️ Note: I am not a licenced surveyor nor claim to be, this is purely a passion project of mine that i am willing to offer as part of my aerial services. For Survey grade maps please look elsewhere
How I Make the Map with PIX4D
1. Initial Processing
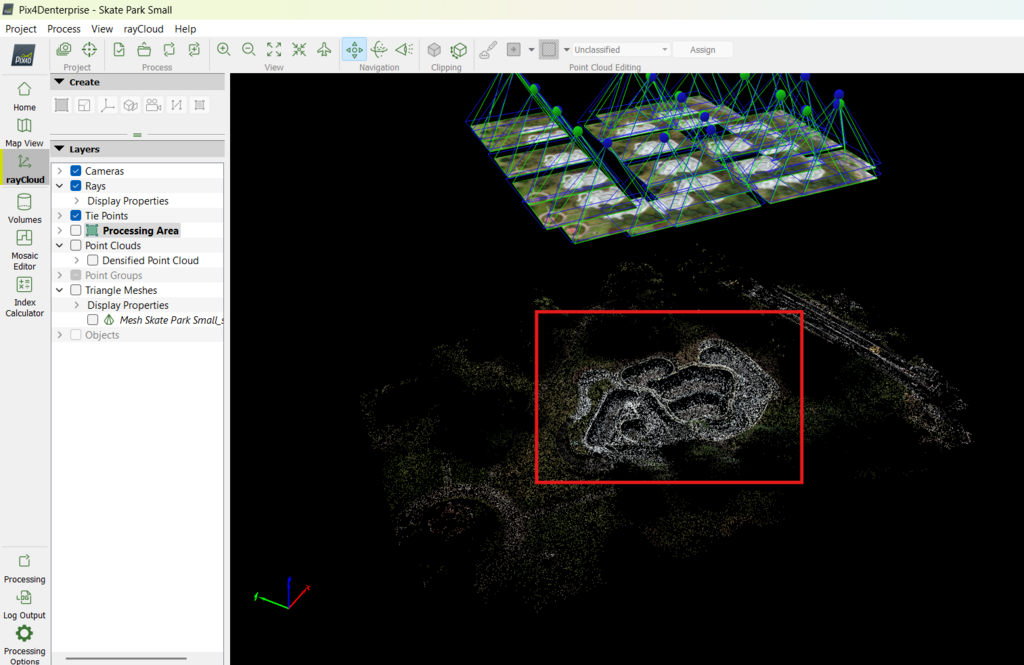
Basic Flight Area highlighted Red
Using the Pix4D software, I begin by importing all collected aerial images and running them through the initial processing step. This stage aligns and stitches the photos together based on their estimated geolocation data recorded by the drone. The result is a sparse point cloud and an initial framework for further 3D reconstruction.
For this example, I mapped a small skate park using the DJI Air 3S. I chose to rely purely on photogrammetry without using any Ground Control Points (GCPs). A total of 23 nadir (downward-facing) images were captured, providing sufficient overlap (greater than 85%) to ensure model accuracy and to allow fast processing given my current hardware limitations.
⚠️ Please note: This was an extremely small project solely to show on my website, typical projects will often require >100 photos to ensure a GDP of <1cm/pixel, again i am not a licenced surveyor nor claim to be. This is purely a non-profit passion project that i am willing to do to help further my education and experience. For Survey-Grade projects please look elsewhere
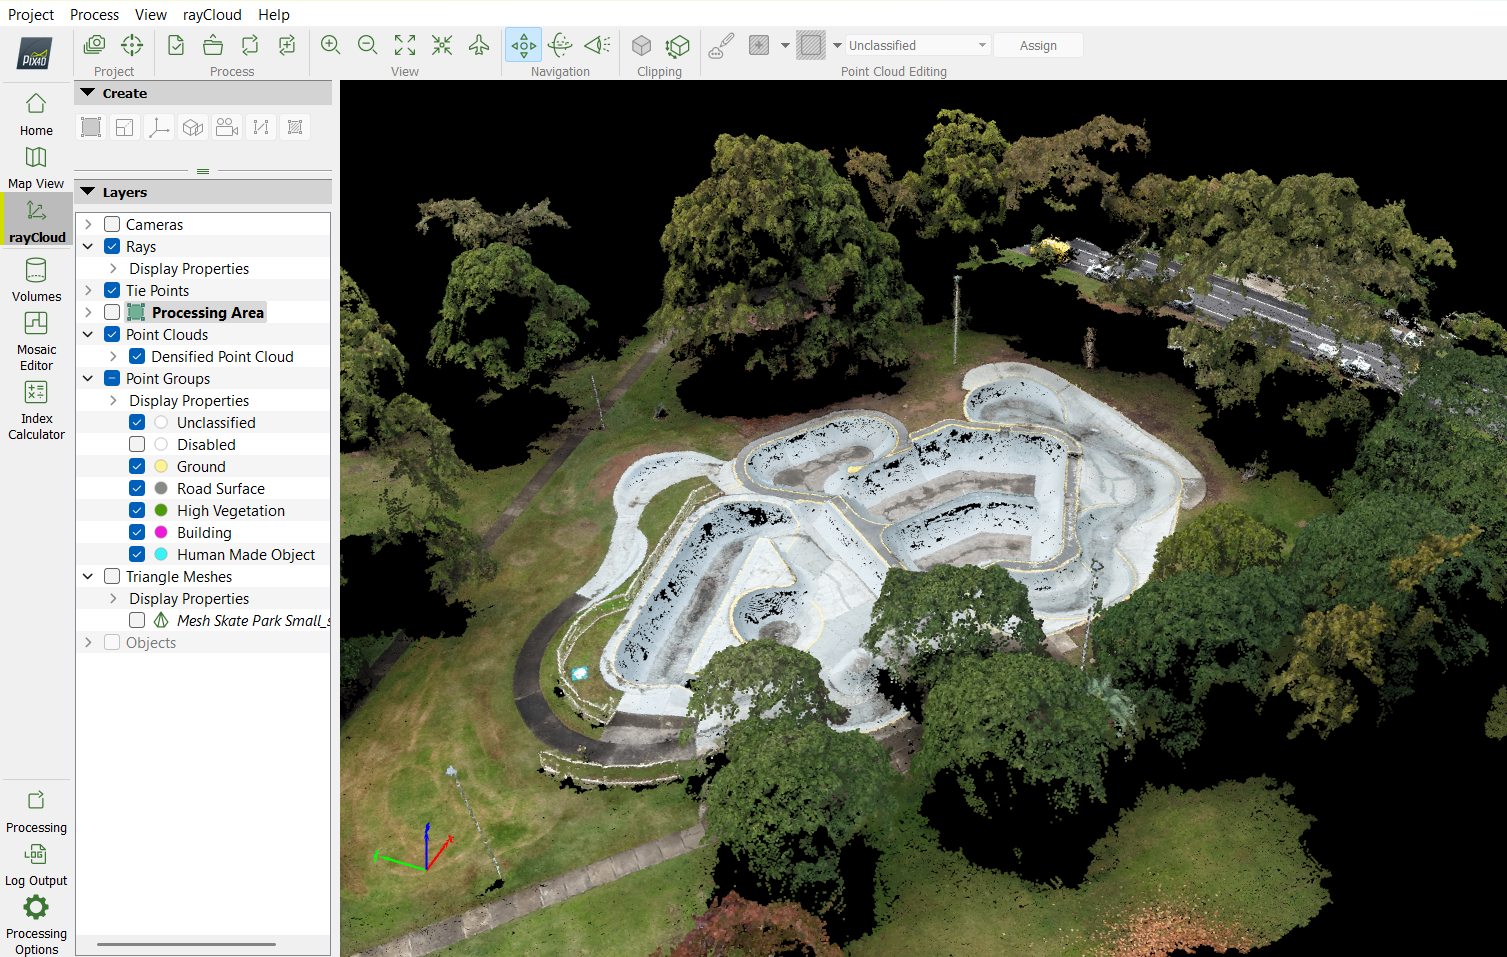
Point Cloud providing preliminary 3D view based on Manual/Automatic Tie Points
The next stage involves generating a densified point cloud using the tools provided in Pix4D. This process uses the results from initial processing to create a much denser and more detailed set of points that define the surface of the mapped area. (Specific results for this example can be found in the Quality Report at the end of this page.)
At this point, I review the data for any errors or gaps, clean up noisy areas if needed, and may recalibrate tie points or re-run the initial processing if alignment issues are detected.
Once satisfied with the point cloud, I move on to generating a 3D triangular mesh, which creates a fully rendered surface model of the site. However, due to the downward-facing nature of the drone’s imagery, these models can lack detail on vertical or undercut features (such as walls or overhangs). This limitation is common when oblique or ground-level imagery isn’t available and can result in models that require further refinement or manual polishing if full realism is required.
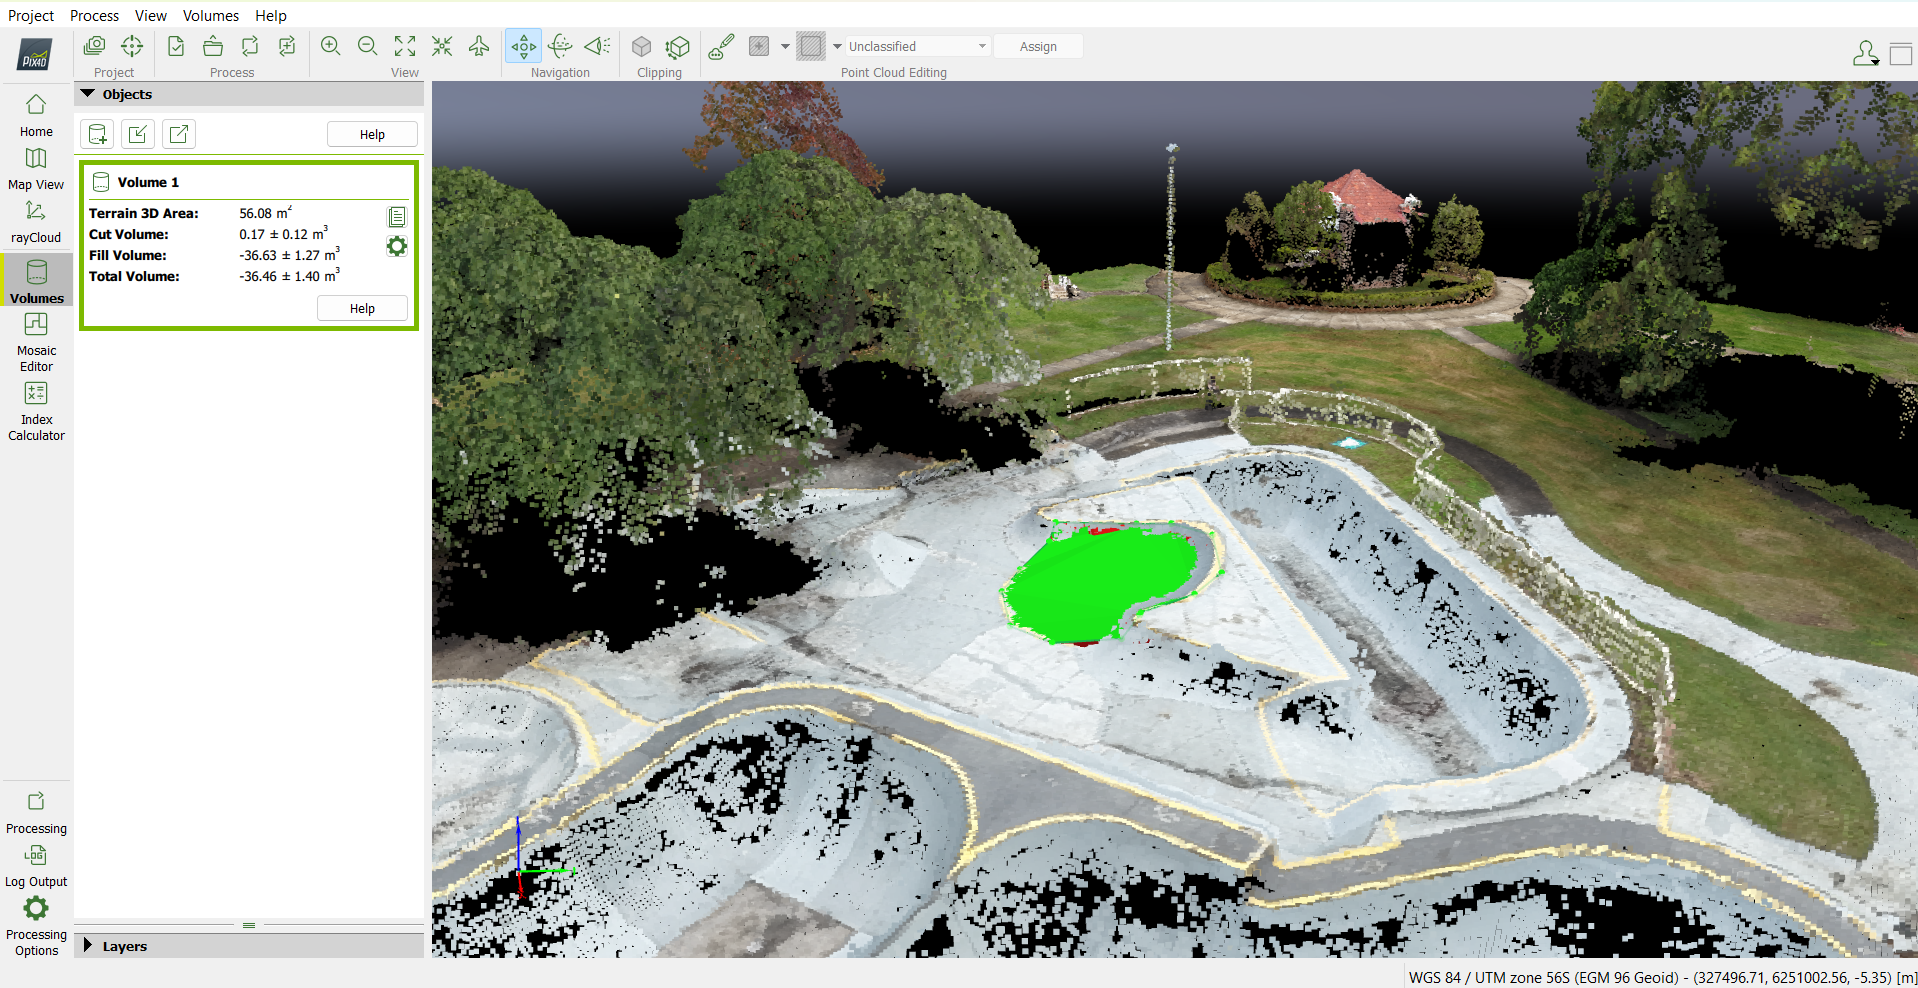
3. Volumetric Calculations
Using Using PIX4D Volume algorithms, accurate estimations of volume can be performed for complex areas
This optional stage involves using Pix4D’s built-in tools to calculate volume and 3D surface area from the processed model. These measurements are commonly used in construction, earthworks, stockpile assessments, and site planning, where accurate quantification of materials or landforms is essential.
Using the mesh or point cloud, I define a region around the object or area of interest (e.g., a stockpile or excavation site). Pix4D then calculates the volume based on a chosen reference surface — such as the lowest point, average elevation, or a custom-defined base.
This capability allows for fast and reliable material estimates, all without needing traditional ground-based measurements. While this feature is optional, it’s available upon request and works best when the site is well-covered during the data collection phase.
4. DSM and Orthomosaic
Ortho, ready to be cropped. (notice how much additional noise is captured despite the flight area being limited to the skating grounds)
The final step involves producing a high-resolution orthomosaic map, stitched together from the geolocated images and 3D data. This orthomosaic serves as a detailed, top-down representation of the surveyed area and can be imported into platforms like ArcGIS for further analysis, annotation, or planning.
⚠️ Please Note: While not survey-grade without additional tools like GCPs or RTK systems, the map is highly accurate for visual planning, site documentation, and surface measurement. It's especially useful for construction monitoring, environmental mapping, and small-scale asset inspections.
Some minor distortions may occasionally appear, even within the main mapped area. These can be caused by factors such as shadows, reflective surfaces, or uniform textures that reduce image clarity. I aim to minimise this through careful planning, consistent overlap, and review of the data before final output.
However, compared to satellite imagery (which often delivers 30–60 m/pixel), this approach can achieve sub- cm resolution, delivering exceptional detail at ground level.
⚠️⚠️ Note: I am not a licenced surveyor nor claim to be, this is purely a passion project of mine that i am willing to offer as part of my aerial services. For Survey grade maps please look elsewhere